| Help |
 |
| 1. Data Source. |
| 2. How to Search? |
| 3. Protein Query Result. |
| 4. Protein Group Query Result. |
| 5. Background Network Quey Result. |
| 6. ExpCluster Platform. |
| 7. CanReceptor Platform. |
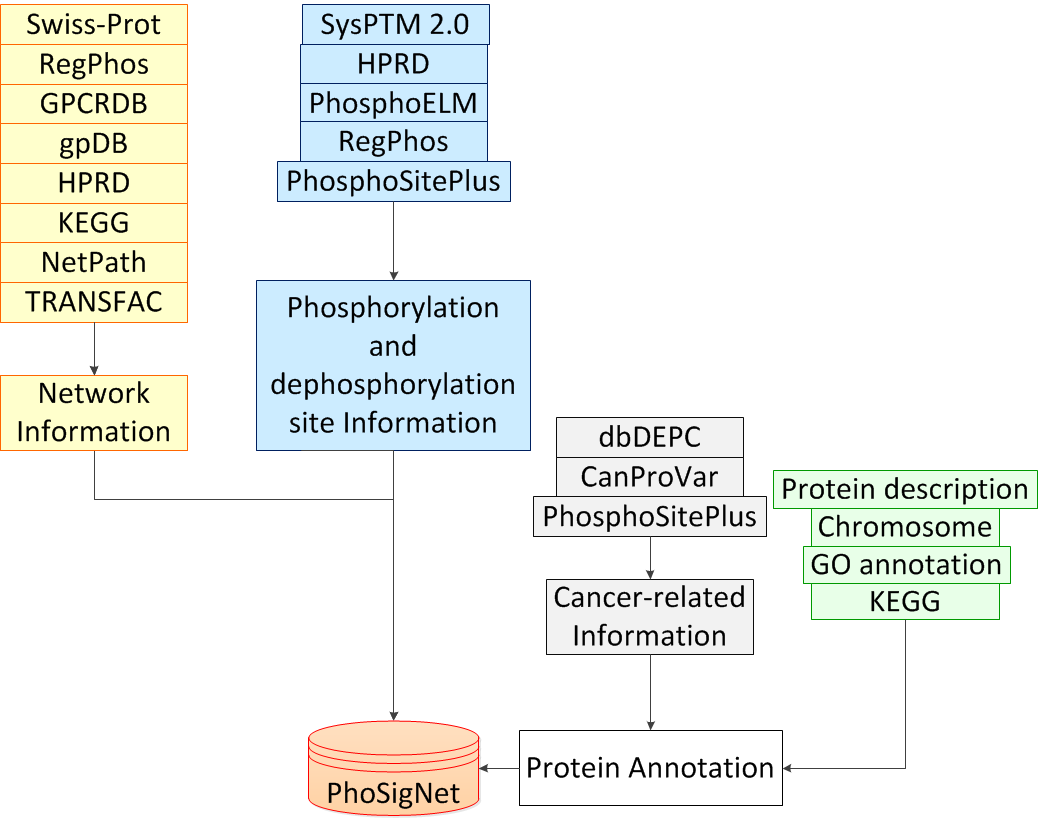
| 1. Data Source. |
| Three types of data were integrated in PhoSigNet: phosphorylation site information, signal transduction information, protein node annotation information. In protein node annotation, other than general function information, cancer-related information was integrated. The following work flow demonstrates the data collection process: |
 |
| 2. How to Search? |
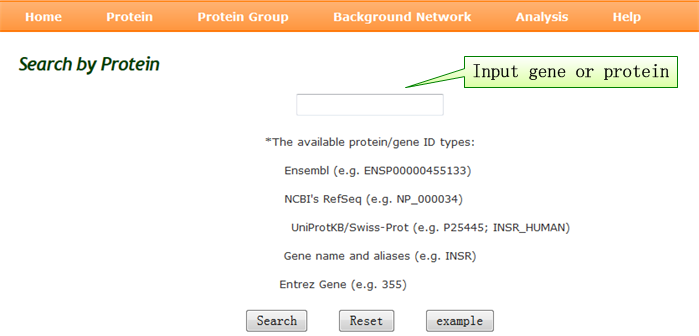
| An online version of PhoSigNet is available, where user can browse database information through three query ways: single protein query, protein group query and background network query. Moreover, two analysis platforms, ExpCluster for dynamic phosphoproteomic data analysis, and CanReceptor for static inferrence of cancer-triggering receptors, have been developed along with the database in PhoSigNet. |
Protein query: all aspects of single protein annotation. |
 |
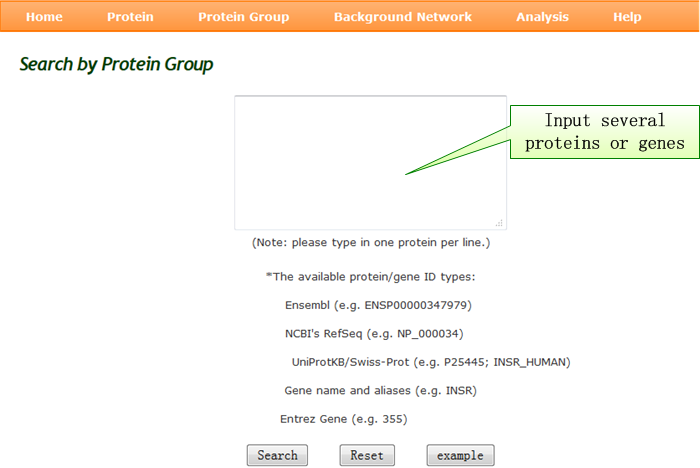
Protein Group query: customized small signaling network or comparative analysis for several proteins. |
 |
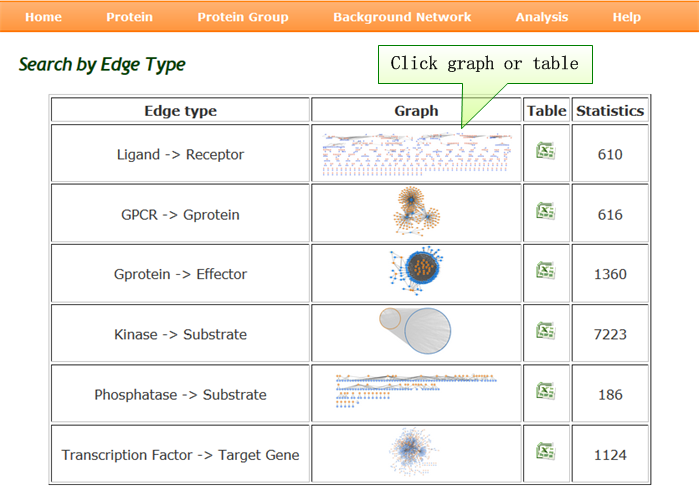
Background Network query: browse interaction pairs by each edge type, and download our data to construct new networks. |
 |
ExpCluster: Dynamic Phosphoproteomics Data Analyzer. |
 |
CanReceptor: Cancer-triggering Receptor Analyzer. |
 |
| 3. Protein Query result. |
| Protein query result is returned as eight sections. “Protein Summary” gives basic protein information, including Uniprot ID linking to public databases, protein description, chromosome location, node attribute in our network; “Phosphorylation site” and “Dephosphorylation site” list the phosphorylation sites and dephosphorylation sites, along with the catalytic kinase and data source for each sites; “Mutation site”, “Differential expressed protein” and “Hyperphosphorylation site” show variation sites, expression change and hyperphosphorylation sites, respectively, along with corresponding cancer name and data source; “Direct Interaction Pairs” provides all interaction pairs, the pair attributes and data sources; “Function Annotation” gives correlated KEGG pathway and Gene Ontology information. |
 |
| 4. Protein Group Query Result. |
| Protein Group query result is returned as two sections: “Protein Summary” shows protein Uniprot ID that can link to more detailed protein information, phosphorylation status, dephosphorylation status, cancer-related information and node attribute in our network. “Upstream and Downstream” shows direct interaction pairs of your queried proteins in table or graph format. Detailed information of each node in the interaction network can also be shown. (A) Protein group query result. (B) Interaction pairs in graph form. (C) Interaction pairs in table form. |
 |
| 5. Background Network Query Result. |
| Through this query, users can browse interaction pairs by each edge type, and download our data to construct new networks. As relations from kinase to substrate are too large to show in one graph, we list all kinases and the number of interaction pairs mediated by corresponding kinase. Clicking the graph or table to identify each of your interested kinases, then users can browse the interaction pairs for each kinase to its substrates. |
 |
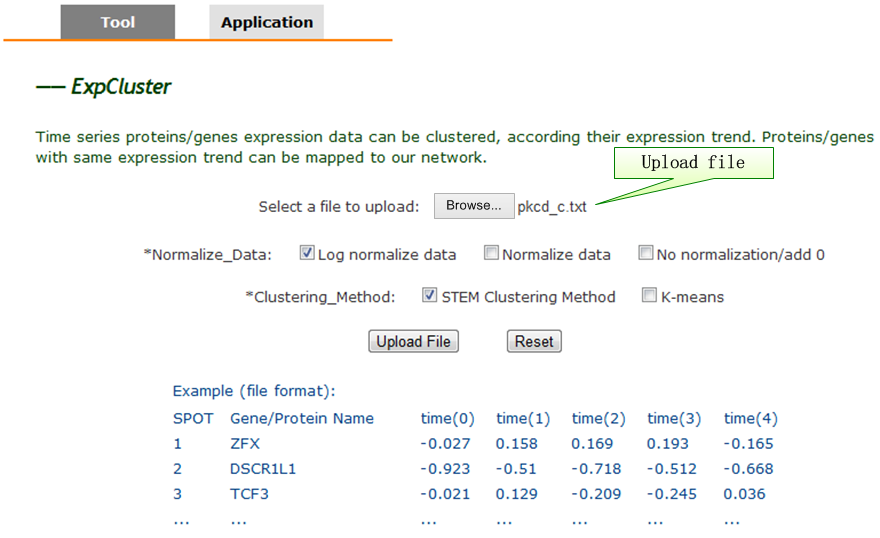
| 6. ExpCluster Platform. |
| Workflow of dynamic data analysis by ExpCluster. (A) ExpCluster tool query interface. (B) Using STEM method, clustering result shows different expression models and statistical significance. (C) Protein/gene expression values in ‘Model Profile 37’. (D) Interaction network. Mapping proteins/genes in ‘Model Profile 37’ to the background network in PhoSigNet. |
 |
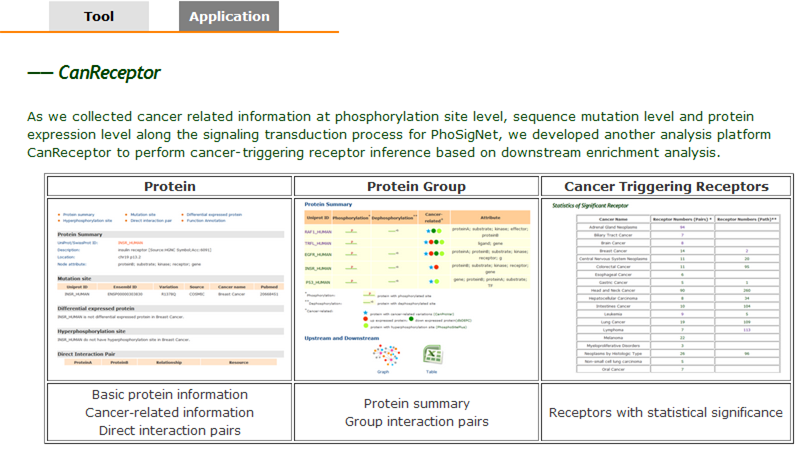
| 7. CanReceptor Platform. |
| As we collected cancer related information at phosphorylation site level, sequence mutation level and protein expression level along the signaling transduction process for PhoSigNet, we developed another analysis platform CanReceptor to perform cancer-triggering receptor inference based on downstream enrichment analysis. Two types of enrichment analyses were designed using hypergeometric test, receptor downstream interaction partner enrichment and receptor downstream pathway elements enrichment. When either downstream interaction partners or pathway elements are enriched with cancer related annotation, the upstream mediating receptor may be a Cancer-triggering receptor. “Cancer-triggering” receptor platform. (A) Query ways in ‘cancer’ application platform. (B) Protein query. (C) Protein group query. (D) Triggering cancer receptors query. |
 |
| [ continue search ] |