
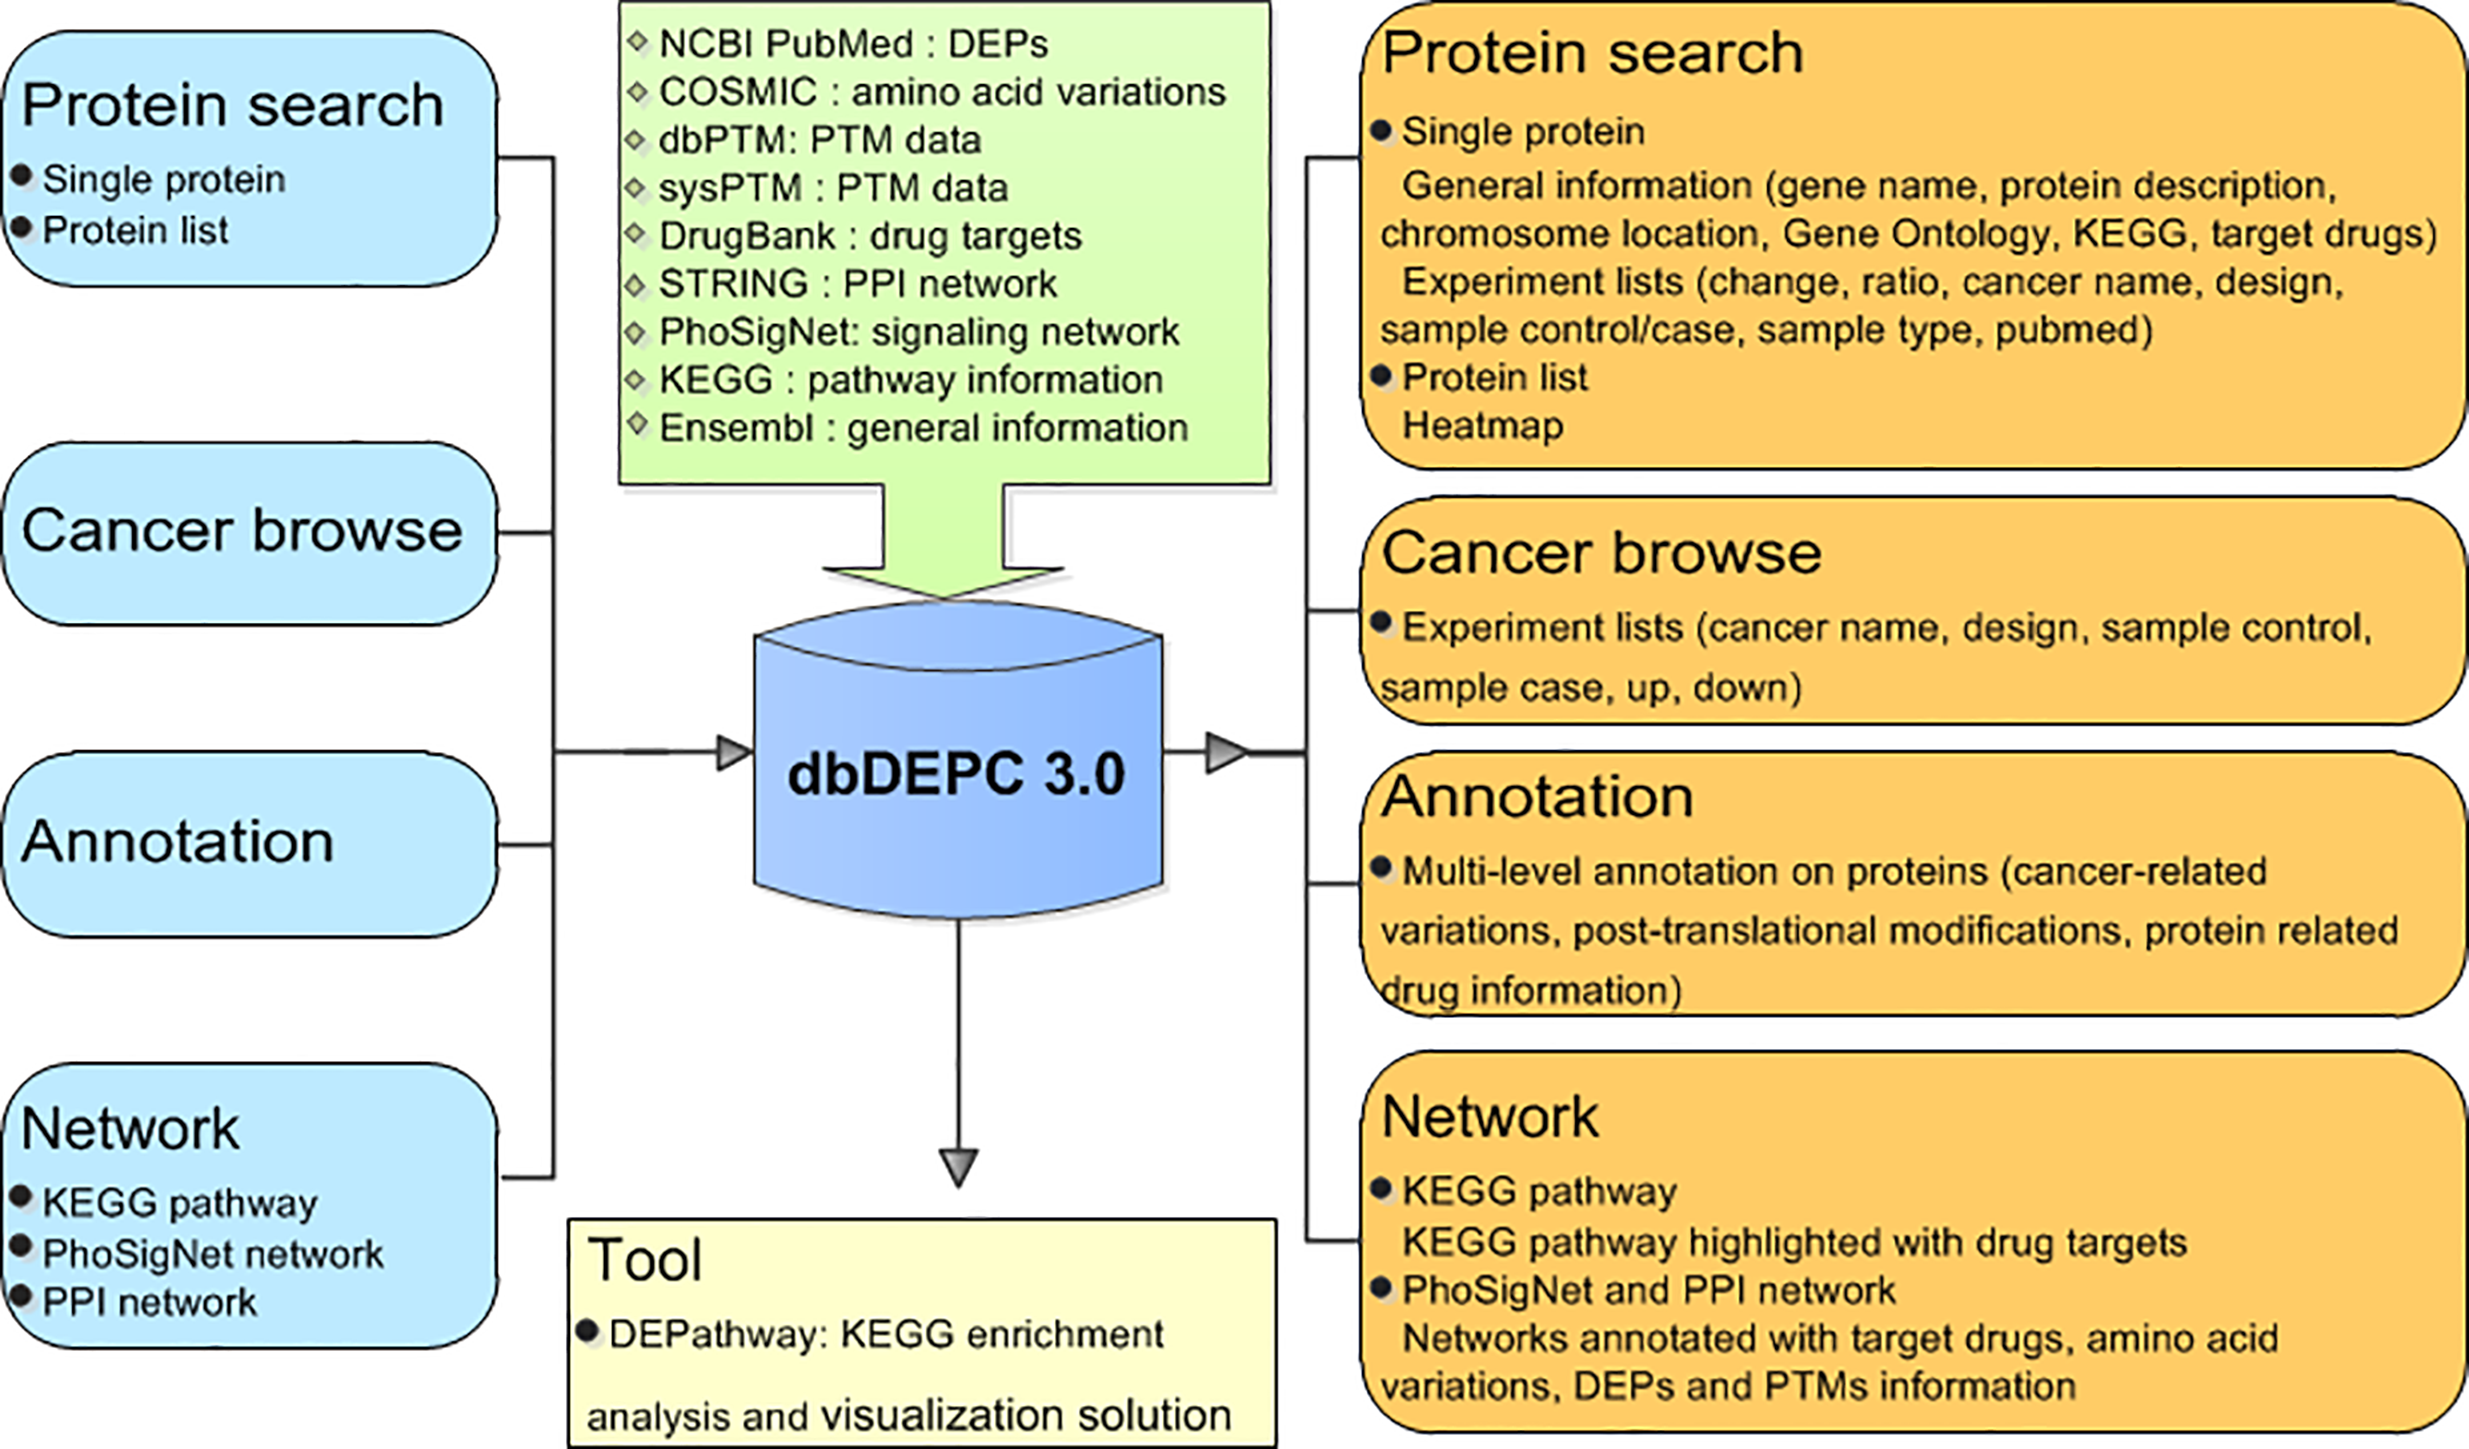
dbDEPC 3.0 provides four query methods, namely, protein query, cancer type query, multi-level annotations of proteins and network based drug indication. An online enrichment analysis tool also has been developed.
 Tutorial in Proteins Page
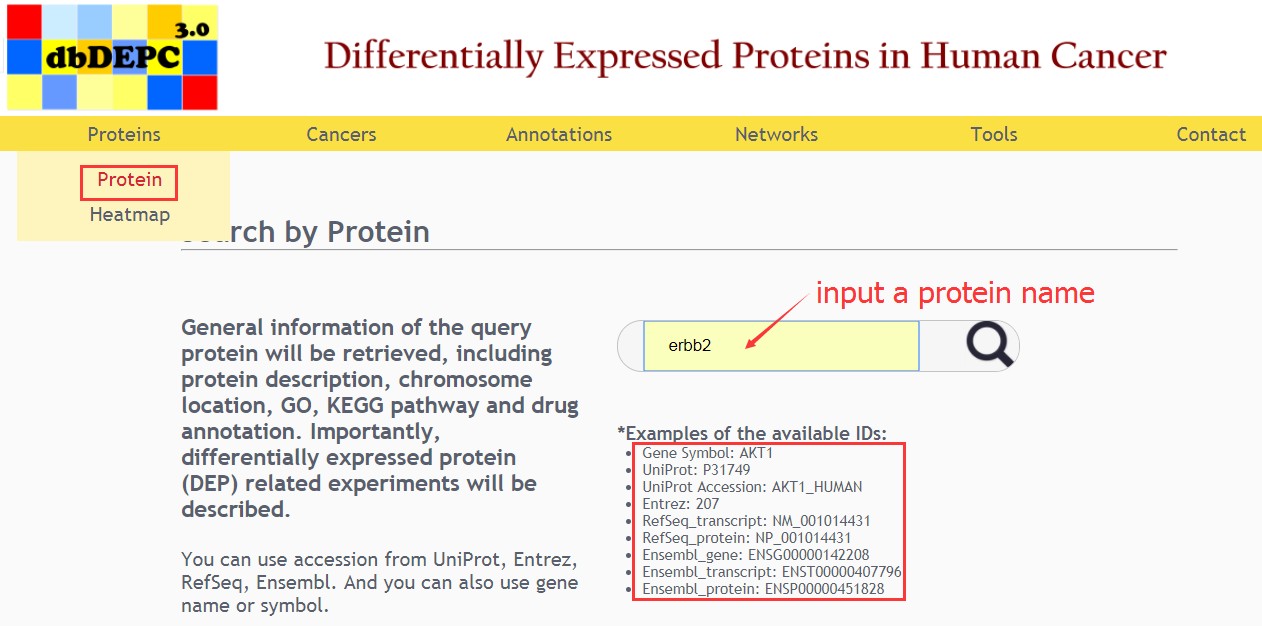
Proteins page allows users to extract summarized information of a protein, and draw a cancer profile heatmap with protein lists.
 Protein query
User can easily use accession from UniProt, Entrez, RefSeq, Ensembl, gene name or gene symbol in the protein search page. Firstly, users fill the input data corresponding to your interesting fields and then click on the button to query the matching proteins.
 Result of protein query
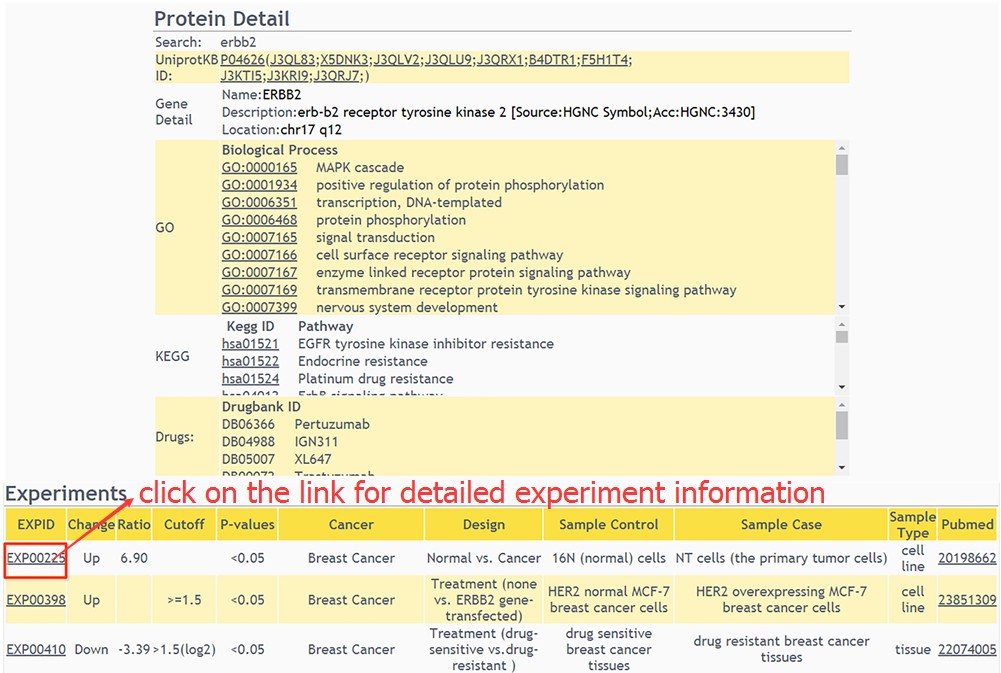
a. The general information (protein description, chromosome location, GO, KEGG pathway and drug annotation) of the protein matching the query keywords are retrieved from our database. Moreover, differentially expressed protein (DEP) related experiments will be shown in a table. To view the detailed information about the experiment, users just click on the link of EXPID.
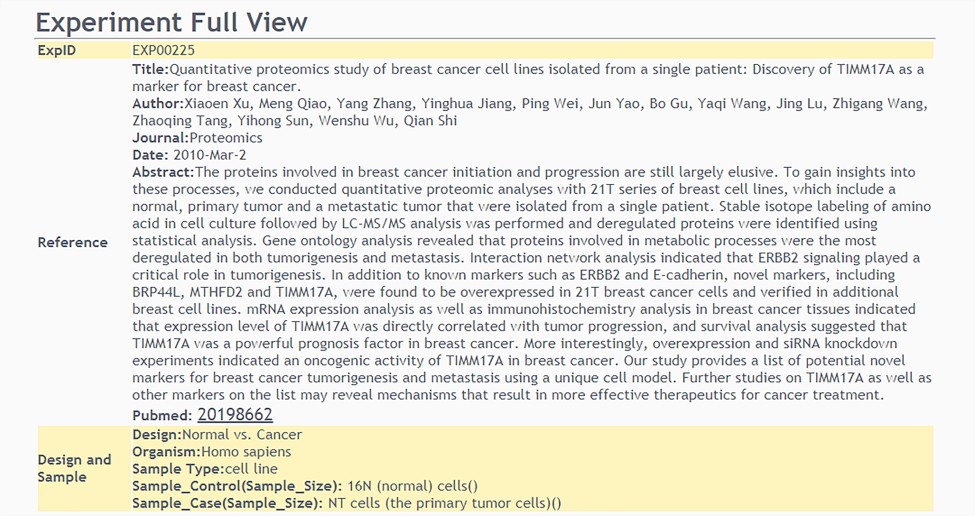
b. The detailed information about experiment is displayed in this page.
 Heatmap query
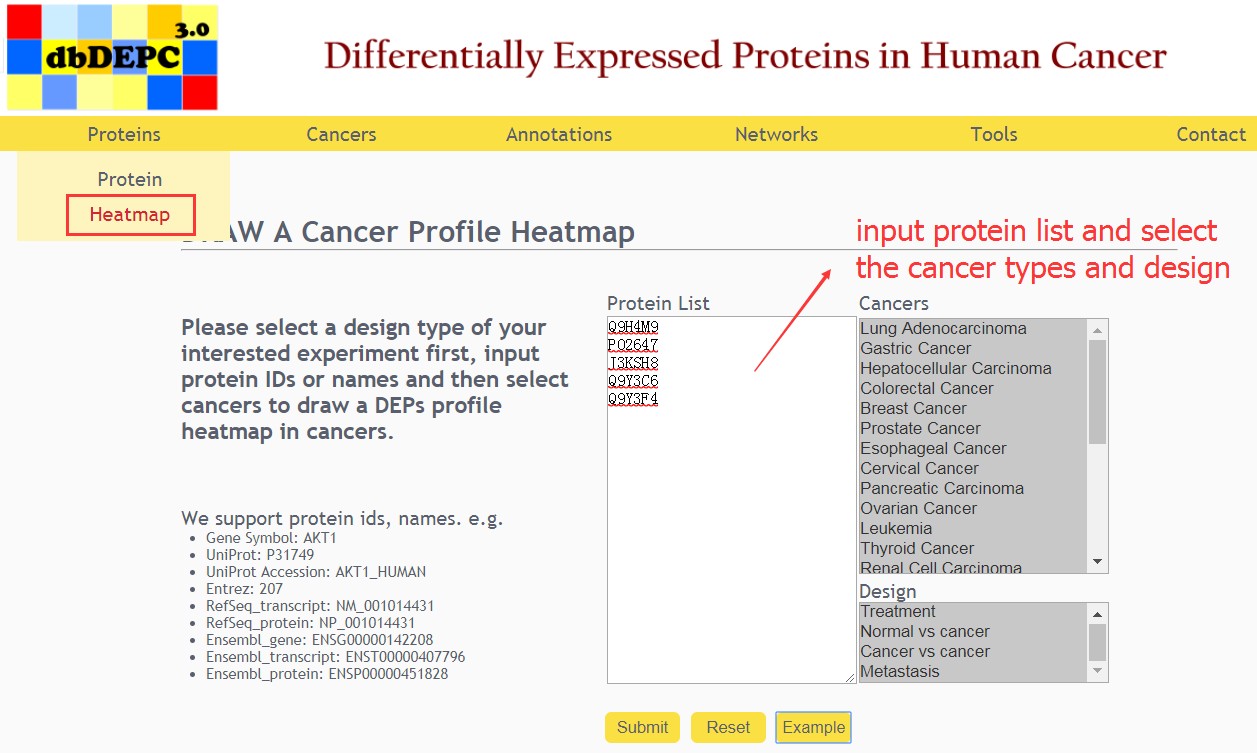
Select a design type of your interested experiment first, input protein IDs or names and then select cancers to draw a DEPs profile heatmap in cancers.
 Result of heatmap query
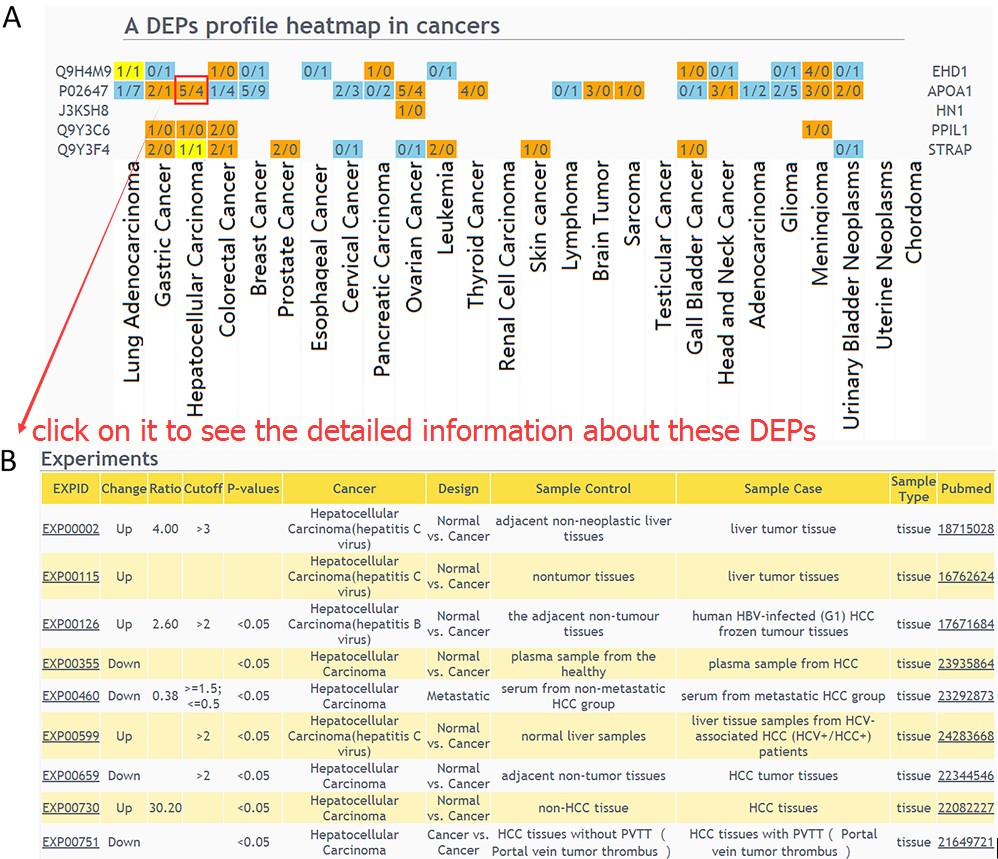
Heatmap of differentially expressed proteins across multiple cancers is visualized(A). If the number of experiments in a specific cancer type is clicked, the detailed information of these DEPs can be displayed(B).
 Tutorial in Cancers Page
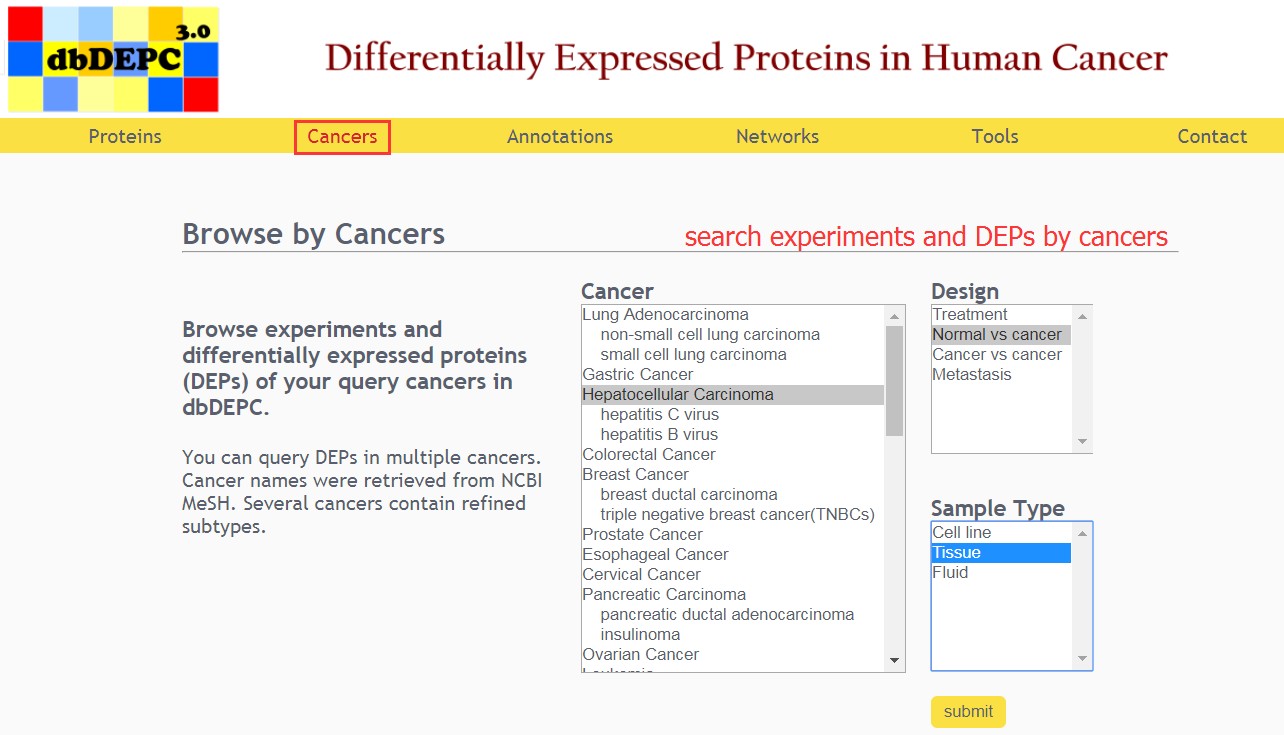
Cancers Page allows users to browse experiments information and DEPs of queried cancers.
Cancers query
Users can select the cancer type, experimental design and sample type of interest.
 Result of cancers query
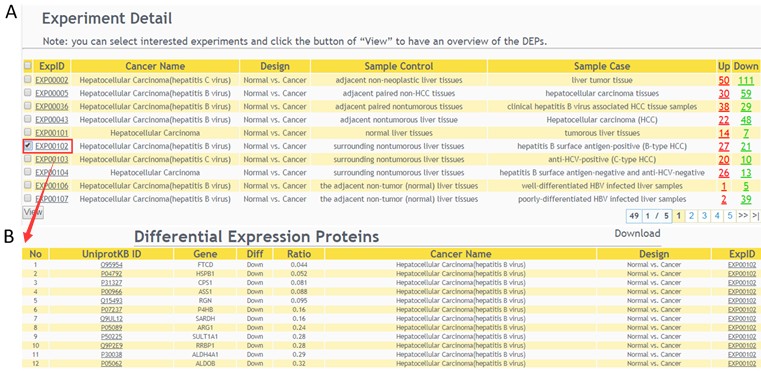
The related MS experiment results of queries will be displayed(A), select interested experiments and click the button of “View” to have an overview of the DEPs(B).
 Tutorial in Annotations Page
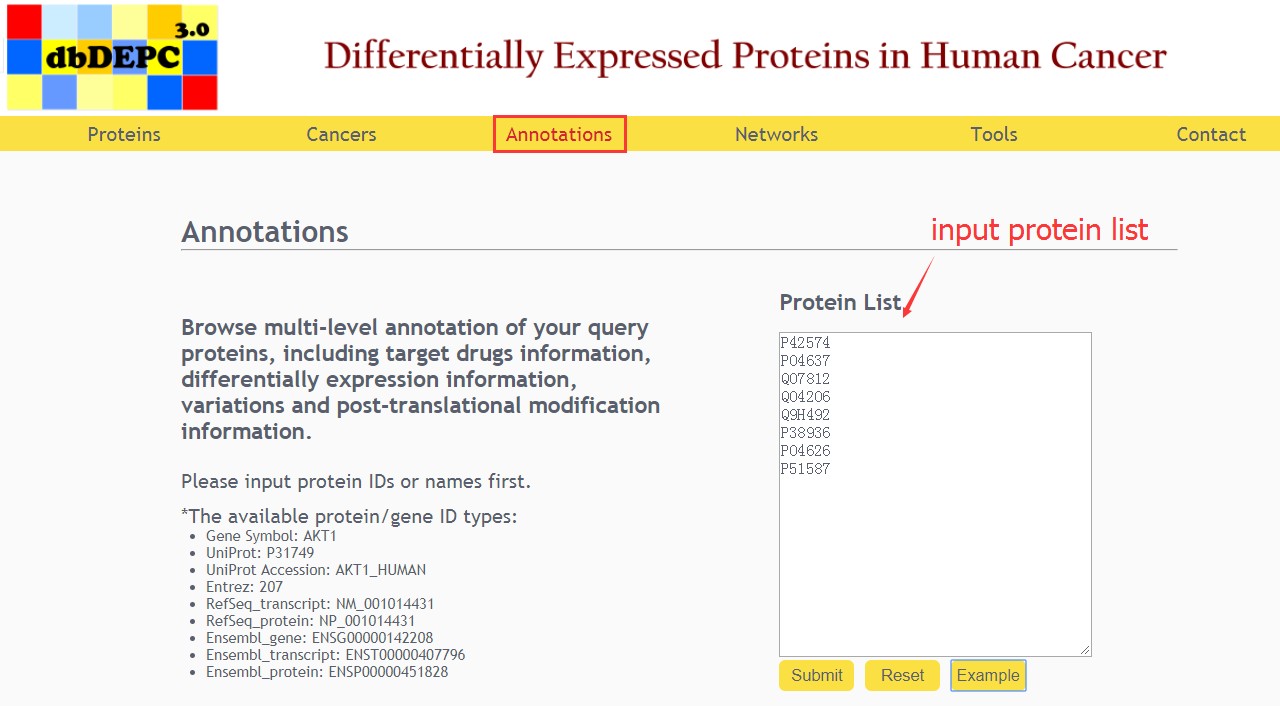
Annotations Page allows users to browse multi-level annotation of interested proteins, including cancer-related variations, post-translational modifications (PTMs), and protein related drug information.
Annotations query
Users can input the protein list to browse multi-level annotation of queried proteins.
 Result of annotations query
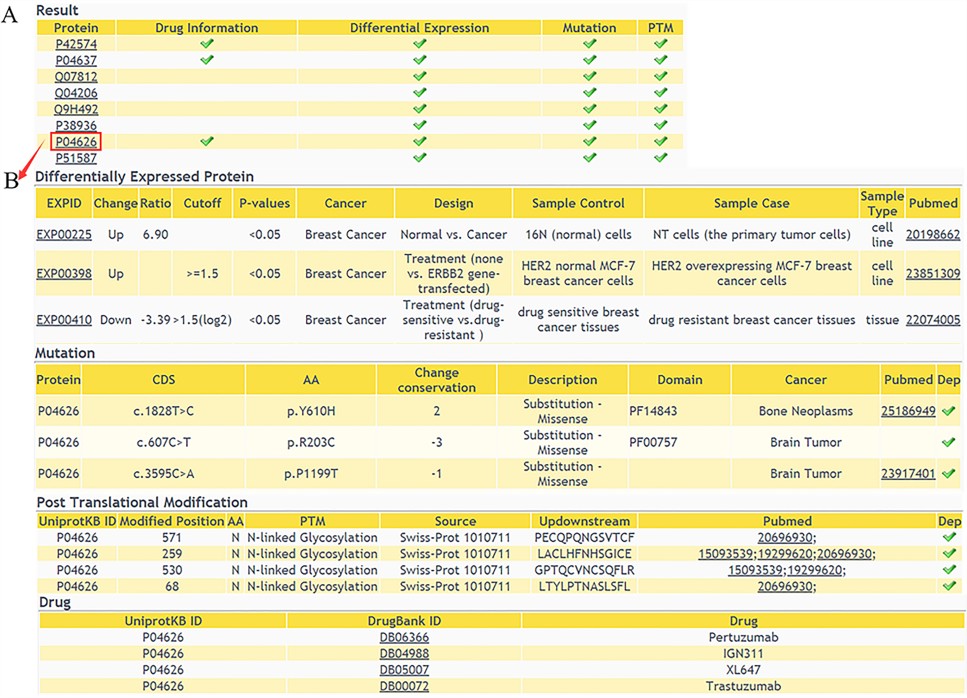
The result shows that whether the queried proteins have multi-level annotations(A), and detailed information of the proteins can be retrieved with a further click(B).
 Tutorial in Networks Page
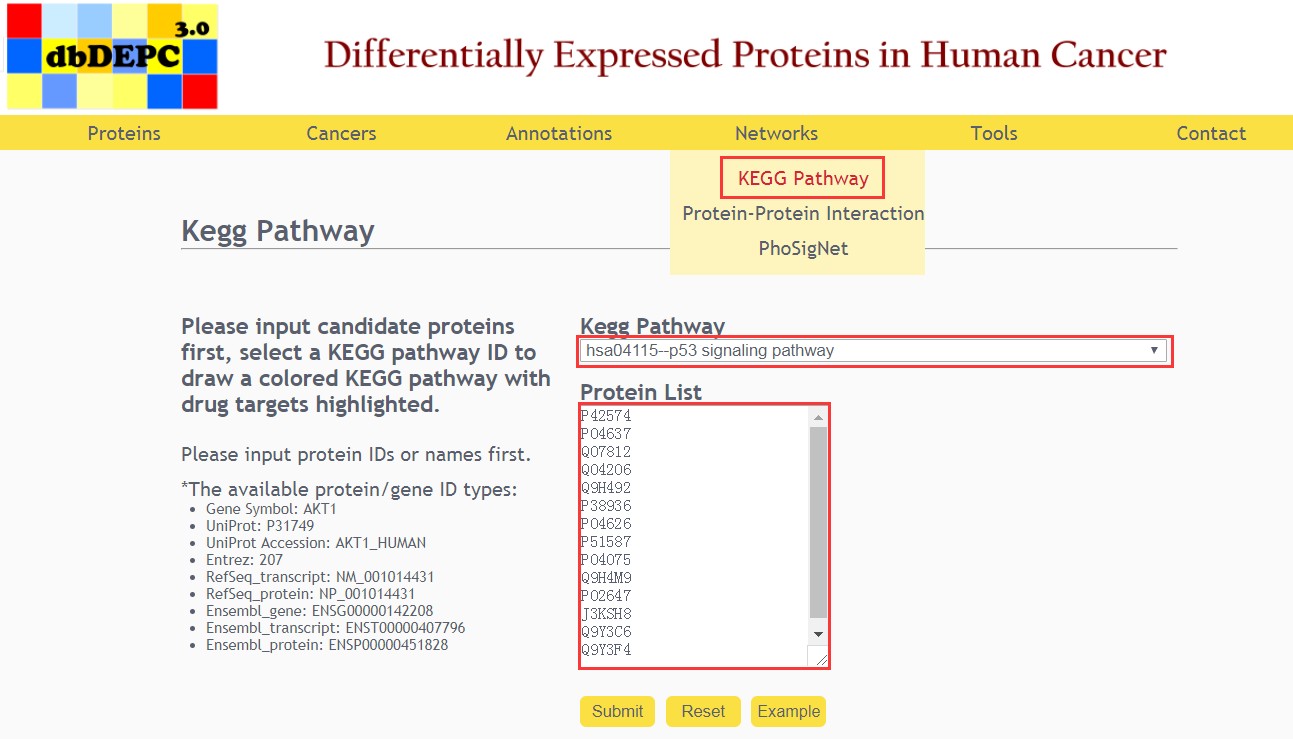
Networks Page allows users to integrated targeting drug information with different biological networks (KEGG Pathway, Protein-Protein Interaction and PhoSigNet).
KEGG Pathway query
First, input the candidate proteins and select the KEGG pathway.
 Result of KEGG pathway query
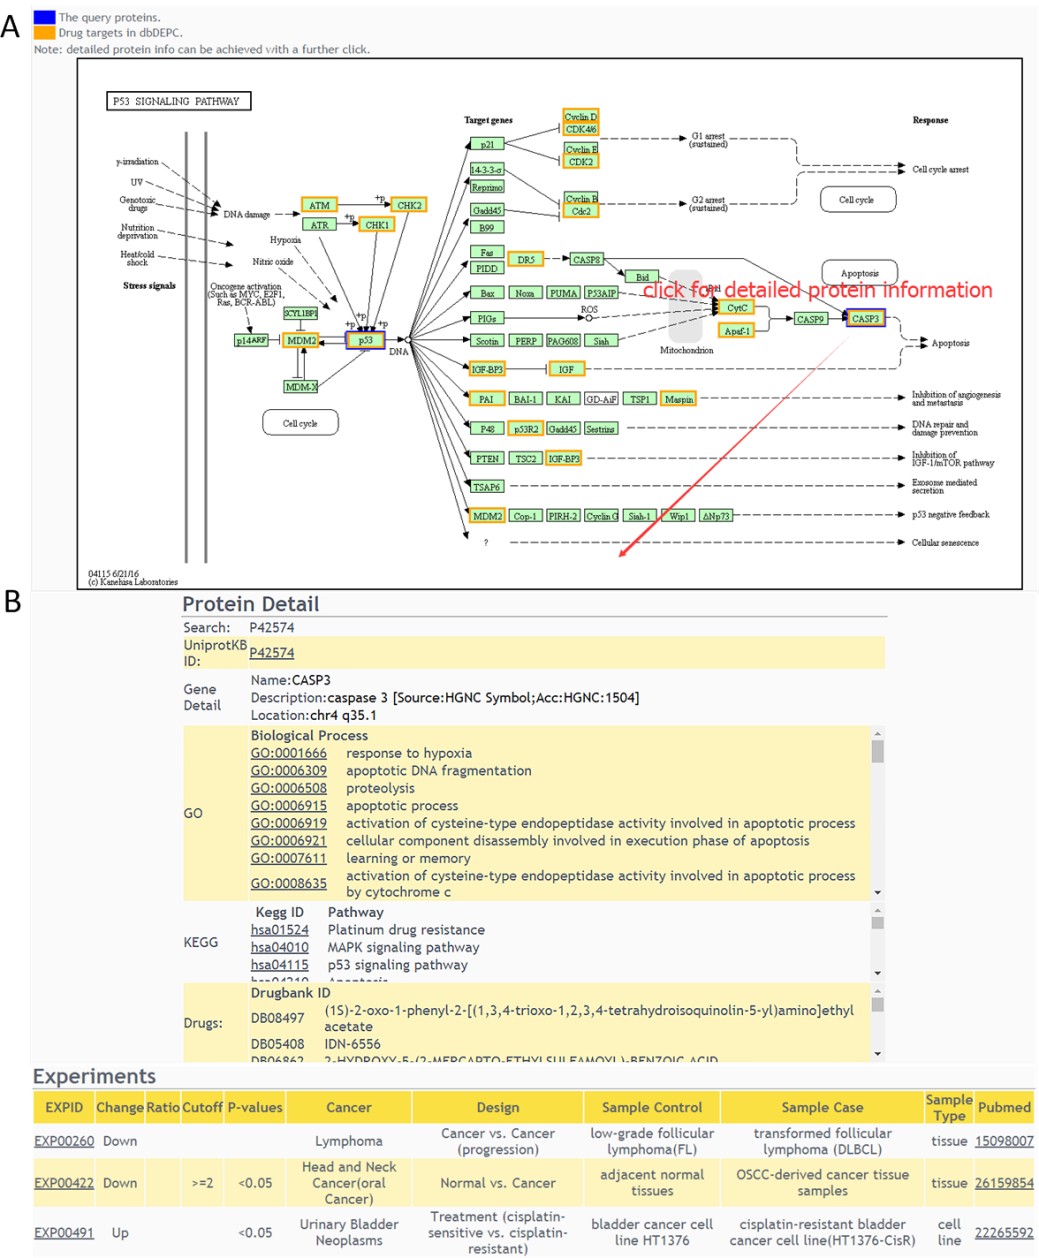
A colored KEGG pathway will be drawn with drug targets highlighted(A), and detailed protein information can be achieved with a further click(B). The “PhoSigNet” query result is similar with “Protein–Protein Interaction” query result.
 Protein-Protein Interaction and PhoSigNet query
Users should input an interested protein first, set an score (0-1000) (which is the confidence provided by STRING database) threshold of network edge, select one or more cancer types and then select annotation types of network node.
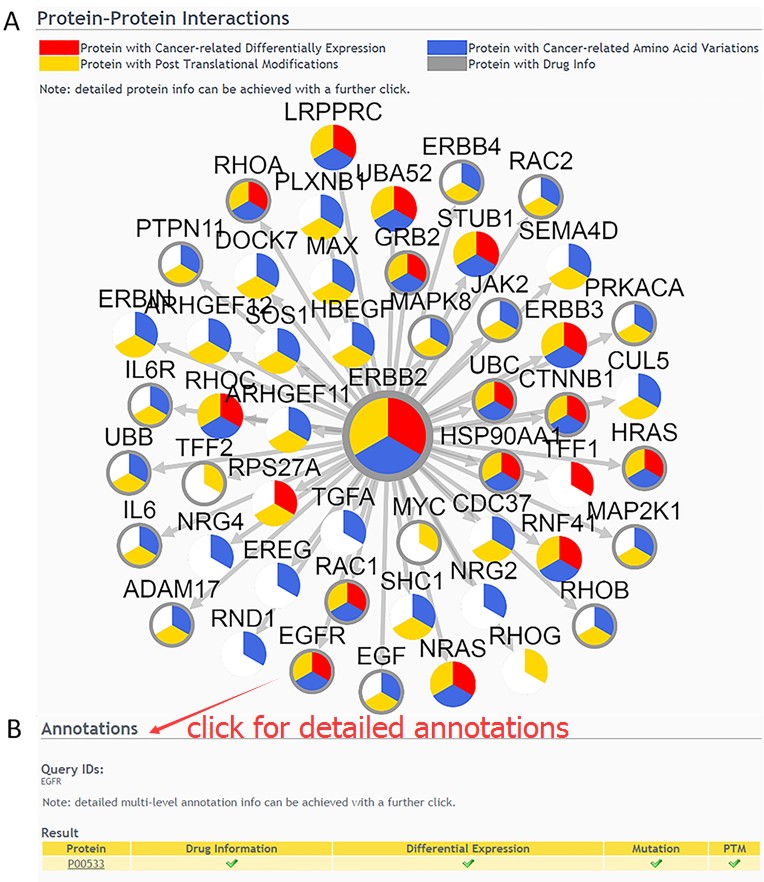
 Result of Protein-Protein Interaction query
The query result shows a network of the first-layer-associated proteins of the interested protein node in dbDEPC(A). Detailed multi-level annotation information can be achieved with a further click(B).
 Tutorial in Tools Page
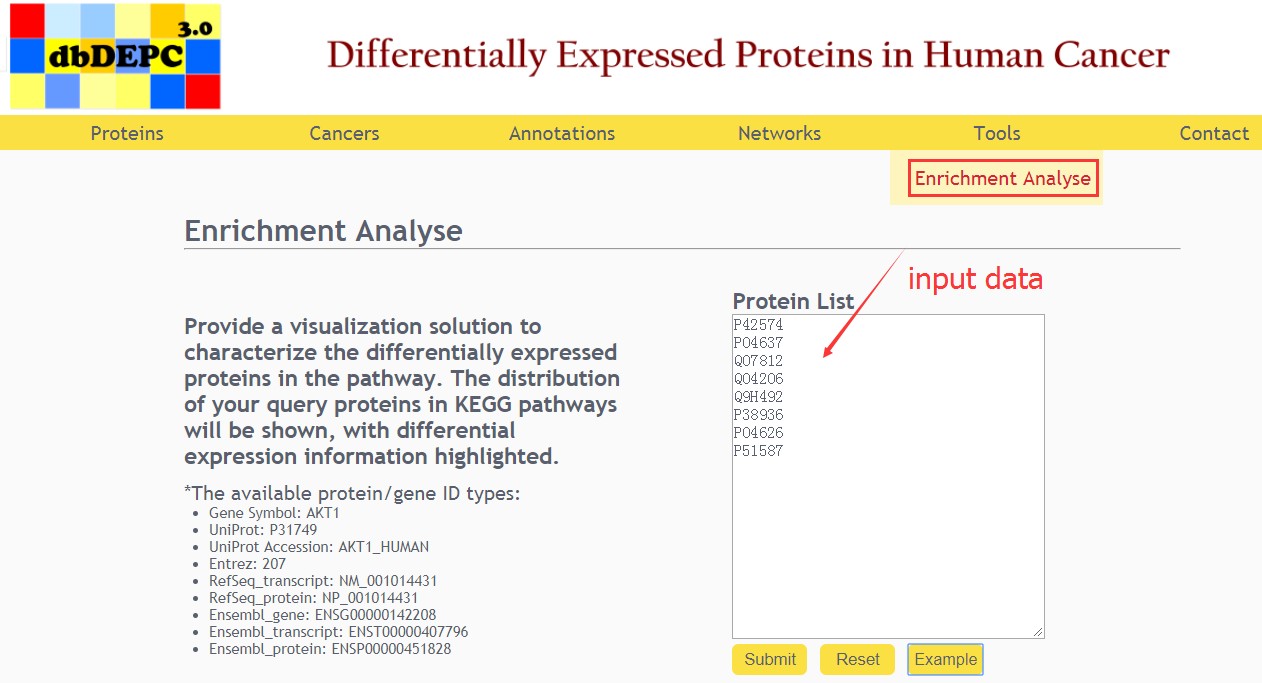
Tools Page provides a visualization solution to characterize the differentially expressed proteins in the pathway.
Enrichment analysis
Input the queried protein list to see the distribution in KEGG pathway.
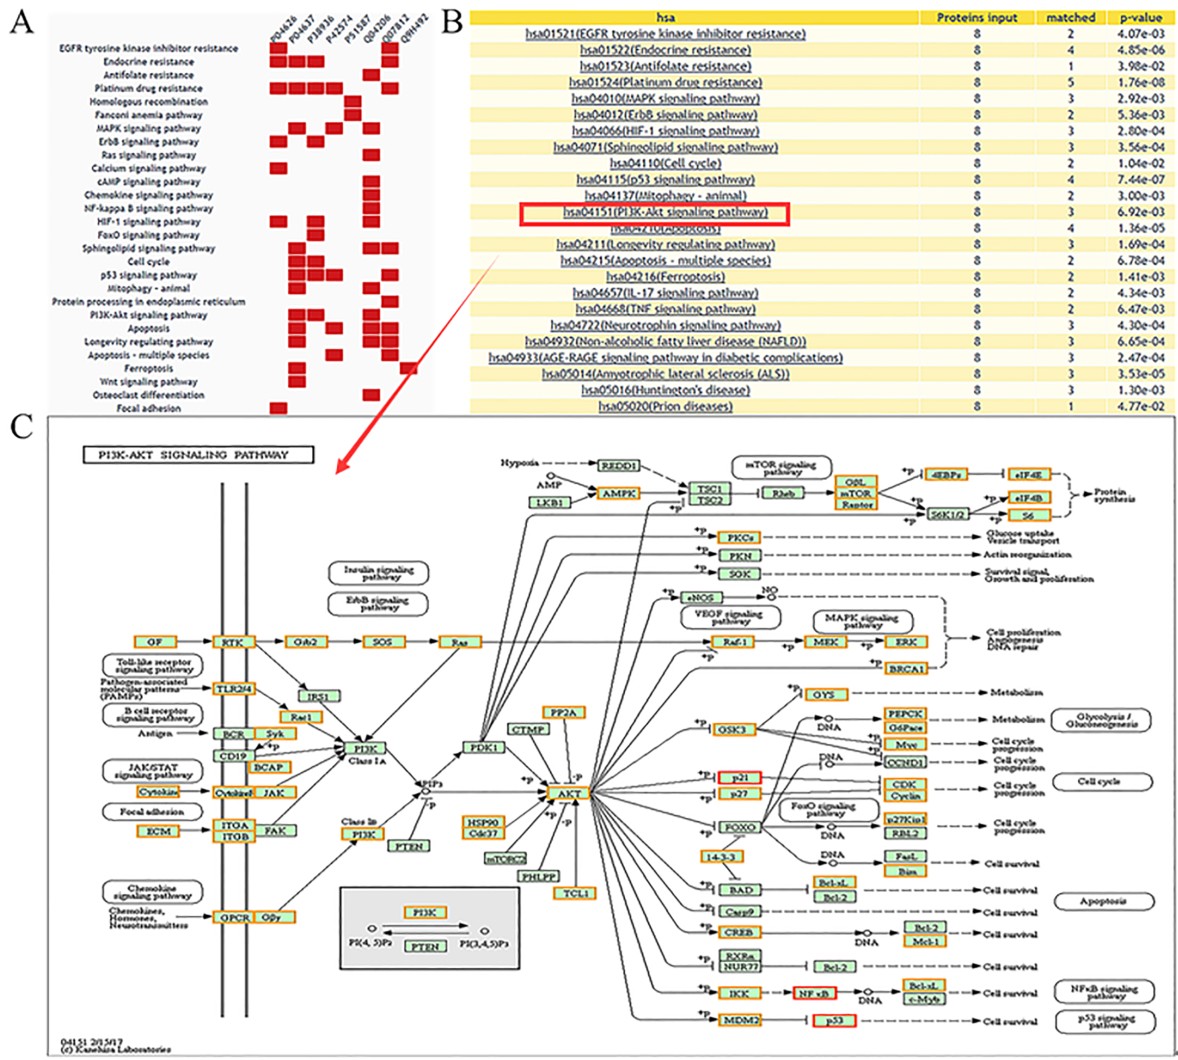
 Result of enrichment analysis
A heatmap to show the distribution in pathways will be displayed(A), and the enriched pathways with a threshold of p-value <= 0.05 are listed(B). With a further click on the specific pathway, the distribution of queried proteins in KEGG pathways will be shown, with differential expression information highlighted(C).
@2017 Qingmin Yang, Yuqi Zhang, Menghuan Zhang, Lu Xie